| Sources | https://github.com/tinkerator/bluespx |
|---|
This program is a web server that shows a spectrum plot for visible light as measured by the Spectryx Blue mobile educational spectrometer.
$ git clone https://github.com/tinkerator/bluespx.git
$ cd bluespx
$ git submodule init
$ git submodule update
These instructions assume you are running the bluespx program on Linux.
If you connect the Spectryx Blue device, via USB to your compter, and
run sudo dmesg the most recent entry will contain a reference to
which USB device file the newly plugged in device was assigned. The
bluespx program is assuming this device is /dev/ttyUSB0 but, if it
is something else, you can use the --tty argument to specify that.
Running the program like this:
$ go run bluespx.go
2024/07/03 18:31:26 sample captured
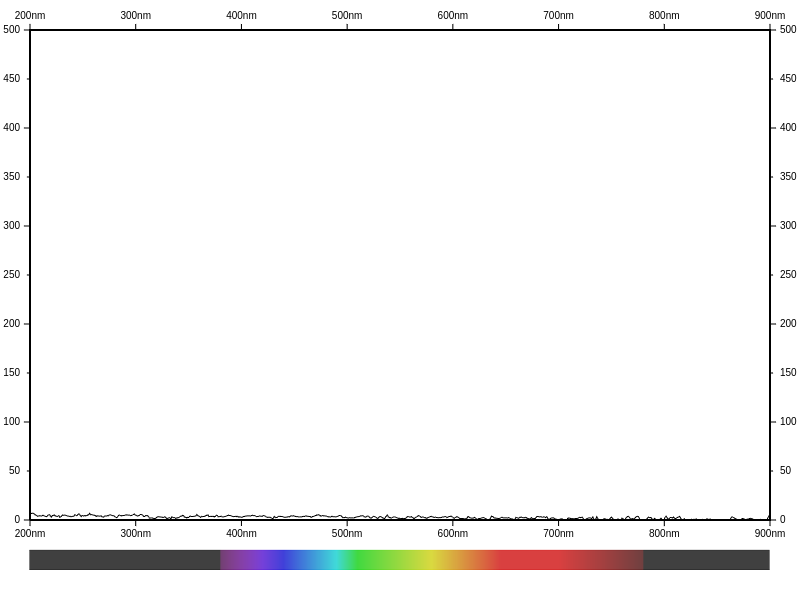
Then visit http://localhost:8080 to see something like this:
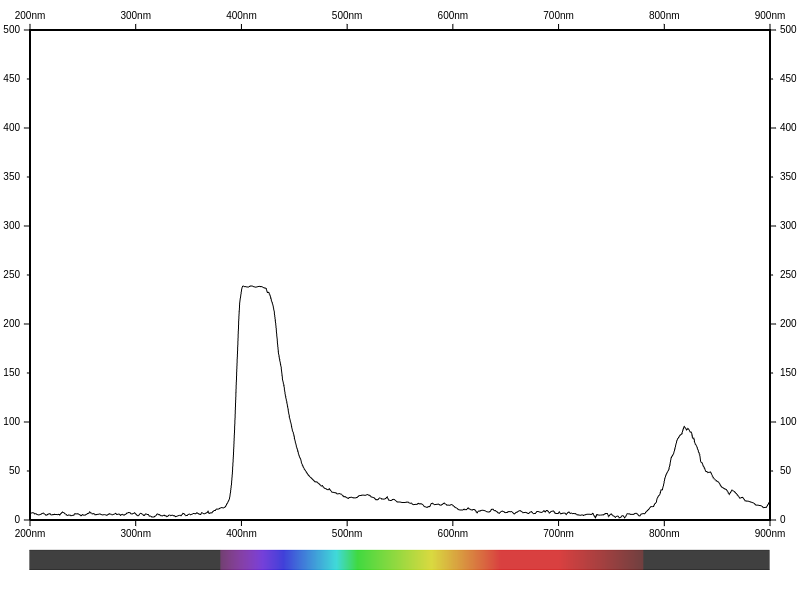
With the UV lamp (bundled with the spectrometer) pointed at the end of the probe, you should be able to see something like this:
There is a “Pause” button on the web page (after the plot). If you press it, the plot will stop updating. You can use this if you want to save the current view in the plot as a PNG (Chrome “right click” on the plot).
This was the setup for the plotter code:
$ git submodule add https://github.com/tinkerator/plotter.git
None. Use the bug tracker to request or suggest some.
See the LICENSE file. The license is the same as the one the Go distribution itself uses.
The program bluespx has been developed purely out of self-interest
and a desire to extract data from one of these Spectroscope
devices. If you find a bug or want to suggest a feature addition,
please use the bug
tracker.
The spectrum pictographic rendering in the above views was inspired by the following FORTRAN code: https://www.physics.sfasu.edu/astro/color/spectra.html which was originally authored by Dan Brouton.